The documentation you are viewing is for Dapr v0.11 which is an older version of Dapr. For up-to-date documentation, see the latest version.
Using OpenTelemetry Collector to collect traces
Dapr can integrate with OpenTelemetry Collector using the Zipkin API. This guide walks through an example to use Dapr to push trace events to Azure Application Insights, through the OpenTelemetry Collector.
Requirements
A installation of Dapr on Kubernetes.
How to configure distributed tracing with Application Insights
Setup Application Insights
- First, you’ll need an Azure account. See instructions here to apply for a free Azure account.
- Follow instructions here to create a new Application Insights resource.
- Get the Application Insights Intrumentation key from your Application Insights page.
Run OpenTelemetry Collector to push to your Application Insights instance
First, save your Application Insights Instrumentation Key in an environment variable
export APP_INSIGHTS_KEY=<your-app-insight-key>
Next, install the OpenTelemetry Collector to your Kubernetes cluster to push events to your Application Insights instance
-
Check out the file open-telemetry-collector.yaml and replace the
<INSTRUMENTATION-KEY>placeholder with yourAPP_INSIGHTS_KEY. -
Apply the configuration with
kubectl apply -f open-telemetry-collector.yaml.
Next, set up both a Dapr configuration file to turn on tracing and deploy a tracing exporter component that uses the OpenTelemetry Collector.
-
Create a collector-config.yaml file with this content
-
Apply the configuration with
kubectl apply -f collector-config.yaml.
Deploy your app with tracing
When running in Kubernetes mode, apply the appconfig configuration by adding a dapr.io/config annotation to the container that you want to participate in the distributed tracing, as shown in the following example:
apiVersion: apps/v1
kind: Deployment
metadata:
  ...
spec:
  ...
  template:
    metadata:
      ...
      annotations:
        dapr.io/enabled: "true"
        dapr.io/app-id: "MyApp"
        dapr.io/app-port: "8080"
        dapr.io/config: "appconfig"
Some of the quickstarts such as distributed calculator already configure these settings, so if you are using those no additional settings are needed.
That’s it! There’s no need include any SDKs or instrument your application code. Dapr automatically handles the distributed tracing for you.
NOTE: You can register multiple tracing exporters at the same time, and the tracing logs are forwarded to all registered exporters.
Deploy and run some applications. After a few minutes, you should see tracing logs appearing in your Application Insights resource. You can also use Application Map to examine the topology of your services, as shown below:
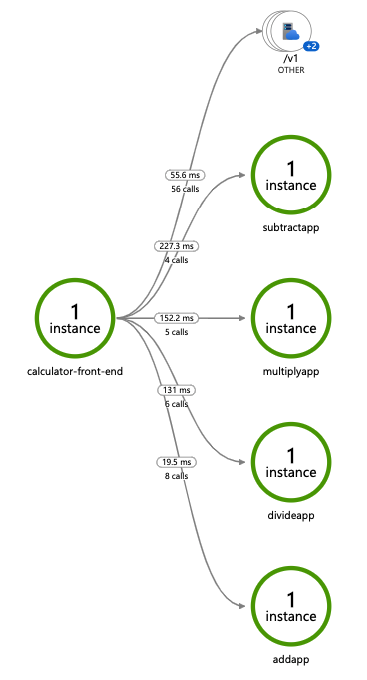
NOTE: Only operations going through Dapr API exposed by Dapr sidecar (e.g. service invocation or event publishing) are displayed in Application Map topology.
Tracing configuration
The tracing section under the Configuration spec contains the following properties:
tracing:
    samplingRate: "1"
The following table lists the different properties.
| Property | Type | Description |
|---|---|---|
| samplingRate | string | Set sampling rate for tracing to be enabled or disabled. |
samplingRate is used to enable or disable the tracing. To disable the sampling rate , set samplingRate : "0" in the configuration. The valid range of samplingRate is between 0 and 1 inclusive. The sampling rate determines whether a trace span should be sampled or not based on value. samplingRate : "1" will always sample the traces. By default, the sampling rate is 1 in 10,000