The documentation you are viewing is for Dapr v0.11 which is an older version of Dapr. For up-to-date documentation, see the latest version.
How-To: Set up Fluentd, Elastic search and Kibana in Kubernetes
Prerequisites
Install Elastic search and Kibana
-
Create namespace for monitoring tool and add Helm repo for Elastic Search
kubectl create namespace dapr-monitoring -
Add Elastic helm repo
helm repo add elastic https://helm.elastic.co helm repo update -
Install Elastic Search using Helm
By default the chart creates 3 replicas which must be on different nodes. If your cluster has less than 3 nodes, specify a lower number of replicas. For example, this sets it to 1:
helm install elasticsearch elastic/elasticsearch -n dapr-monitoring --set replicas=1
Otherwise:
helm install elasticsearch elastic/elasticsearch -n dapr-monitoring
If you are using minikube or want to disable persistent volumes for development purposes, you can disable it by using the following command:
helm install elasticsearch elastic/elasticsearch -n dapr-monitoring --set persistence.enabled=false --replicas=1
-
Install Kibana
helm install kibana elastic/kibana -n dapr-monitoring -
Validation
Ensure Elastic Search and Kibana are running in your Kubernetes cluster.
kubectl get pods -n dapr-monitoring
NAME                            READY   STATUS    RESTARTS   AGE
elasticsearch-master-0          1/1     Running   0          6m58s
kibana-kibana-95bc54b89-zqdrk   1/1     Running   0          4m21s
Install Fluentd
- Install config map and Fluentd as a daemonset
Download these config files:
Note: If you already have Fluentd running in your cluster, please enable the nested json parser to parse JSON formatted log from Dapr.
Apply the configurations to your cluster:
kubectl apply -f ./fluentd-config-map.yaml
kubectl apply -f ./fluentd-dapr-with-rbac.yaml
- Ensure that Fluentd is running as a daemonset; the number of instances should be the same as the number of cluster nodes. In the example below we only have 1 node.
kubectl get pods -n kube-system -w
NAME                          READY   STATUS    RESTARTS   AGE
coredns-6955765f44-cxjxk      1/1     Running   0          4m41s
coredns-6955765f44-jlskv      1/1     Running   0          4m41s
etcd-m01                      1/1     Running   0          4m48s
fluentd-sdrld                 1/1     Running   0          14s
Install Dapr with JSON formatted logs
-
Install Dapr with enabling JSON-formatted logs
helm repo add dapr https://dapr.github.io/helm-charts/ helm repo update helm install dapr dapr/dapr --namespace dapr-system --set global.logAsJson=true -
Enable JSON formatted log in Dapr sidecar
Add dapr.io/log-as-json: "true" annotation to your deployment yaml.
Example:
apiVersion: apps/v1
kind: Deployment
metadata:
  name: pythonapp
  namespace: default
  labels:
    app: python
spec:
  replicas: 1
  selector:
    matchLabels:
      app: python
  template:
    metadata:
      labels:
        app: python
      annotations:
        dapr.io/enabled: "true"
        dapr.io/app-id: "pythonapp"
        dapr.io/log-as-json: "true"
...
Search logs
Note: Elastic Search takes a time to index the logs that Fluentd sends.
- Port-forward to svc/kibana-kibana
$ kubectl port-forward svc/kibana-kibana 5601 -n dapr-monitoring
Forwarding from 127.0.0.1:5601 -> 5601
Forwarding from [::1]:5601 -> 5601
Handling connection for 5601
Handling connection for 5601
-
Browse
http://localhost:5601 -
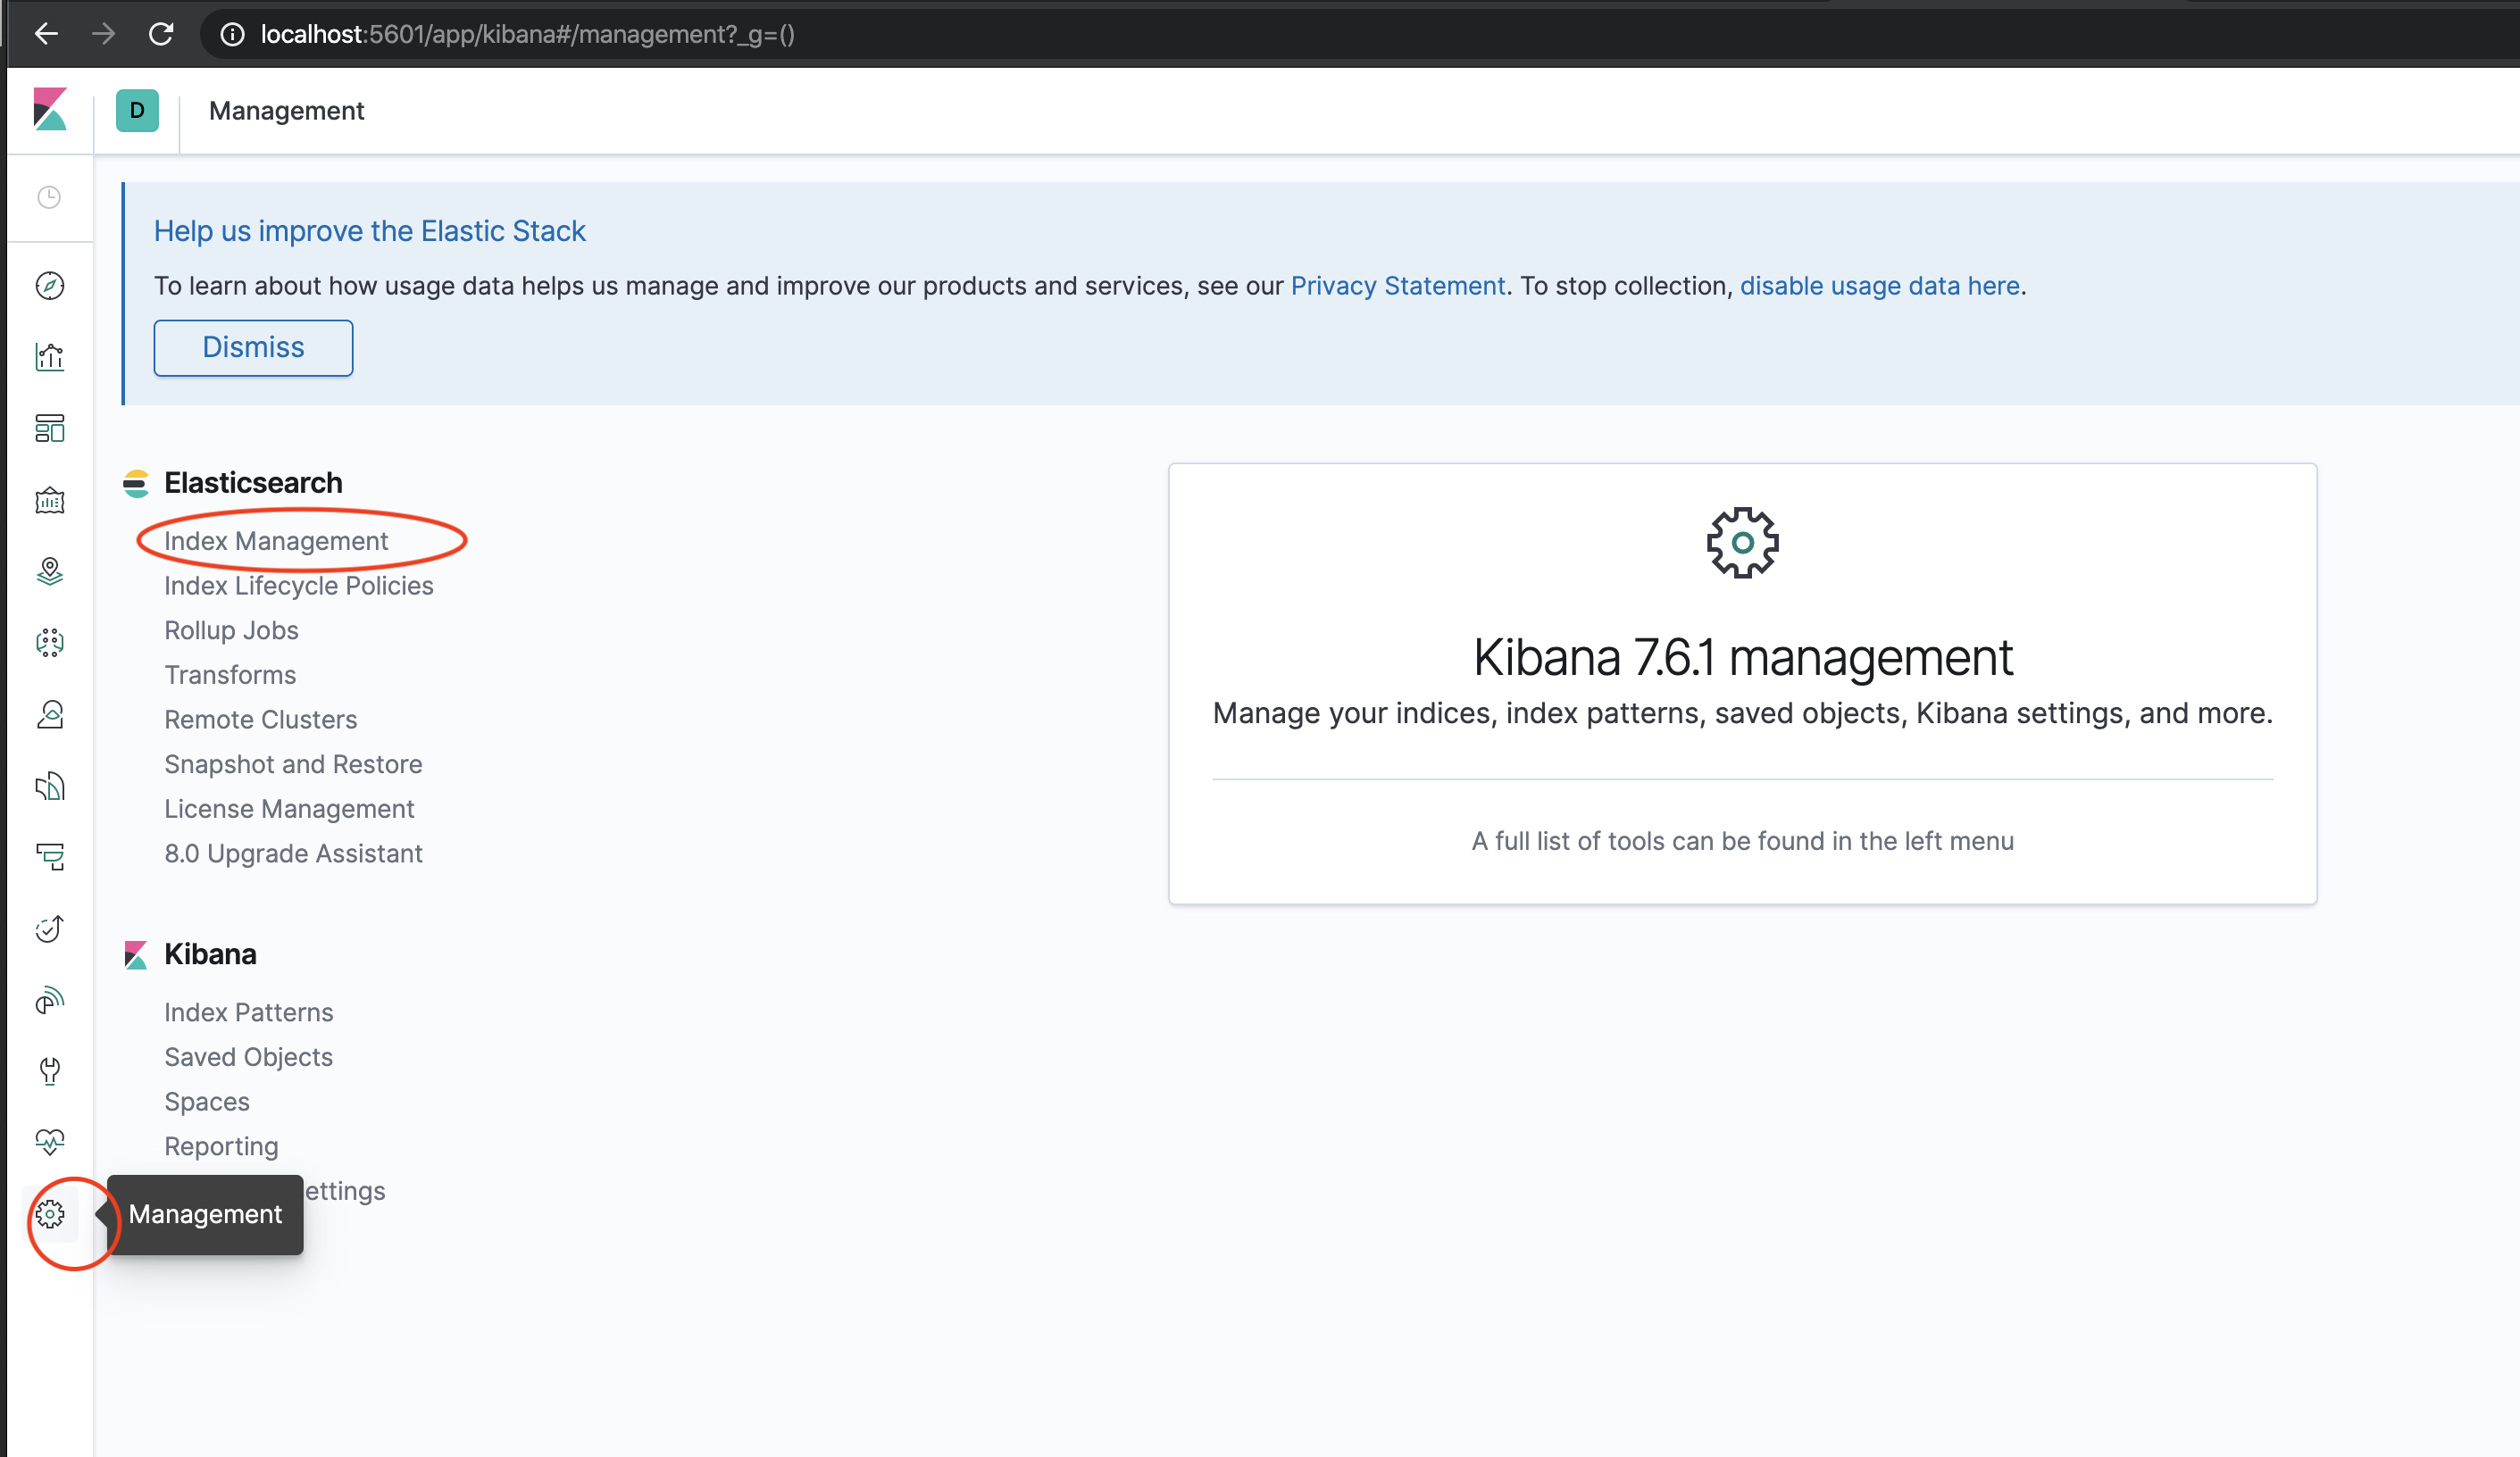
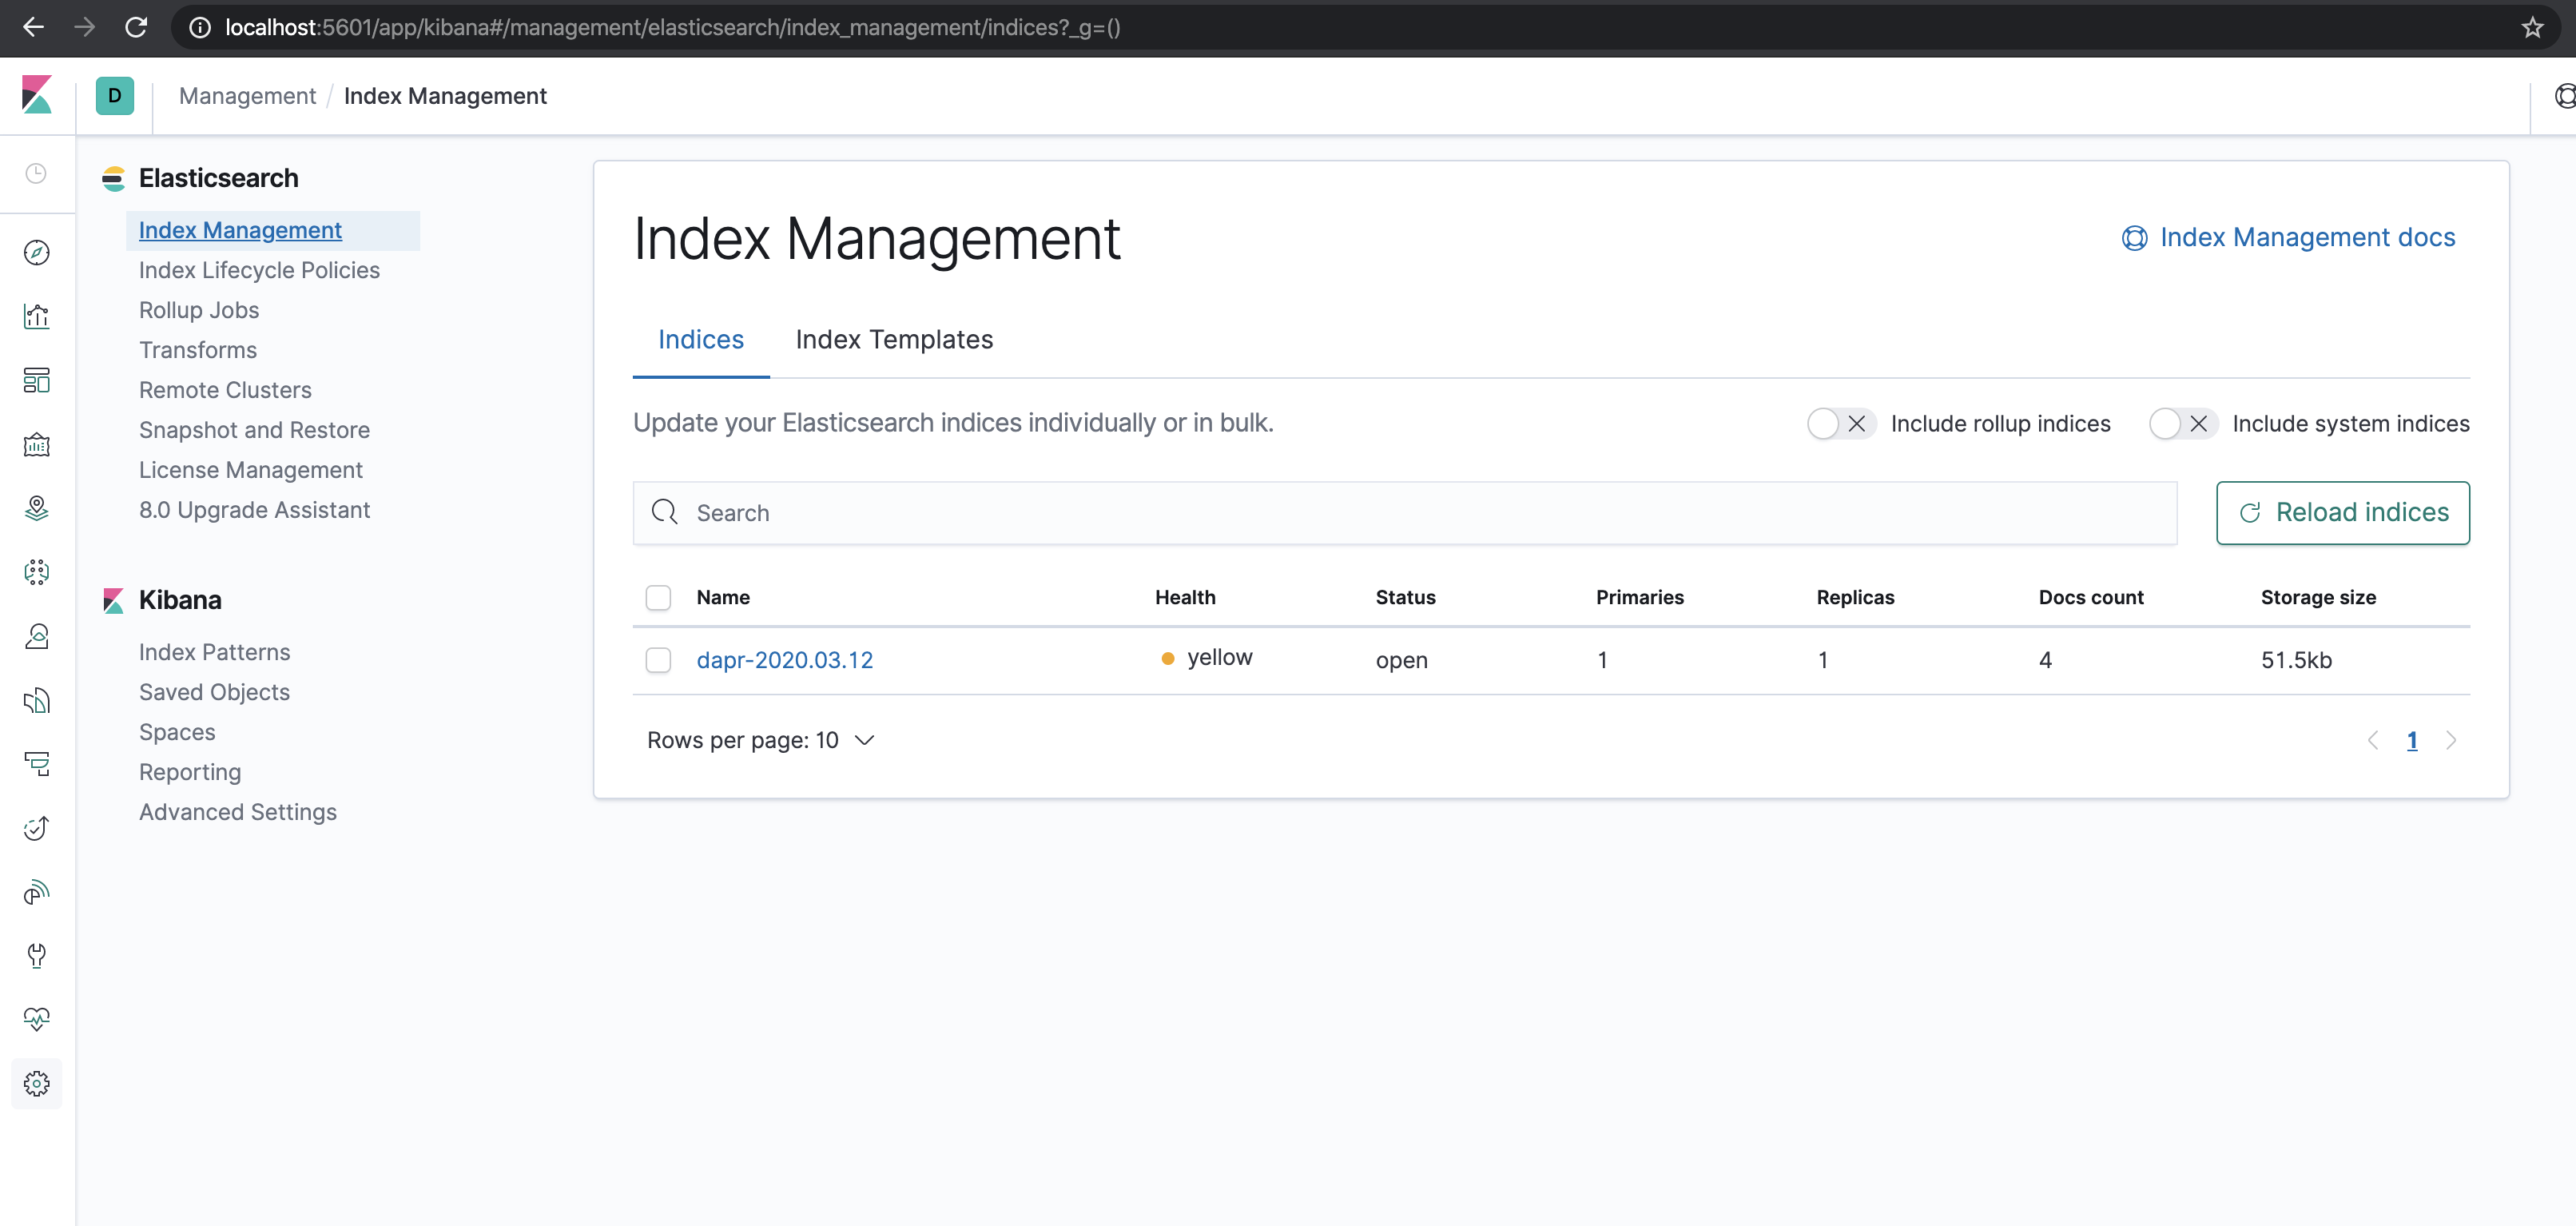
Click Management -> Index Management
- Wait until dapr-* is indexed.
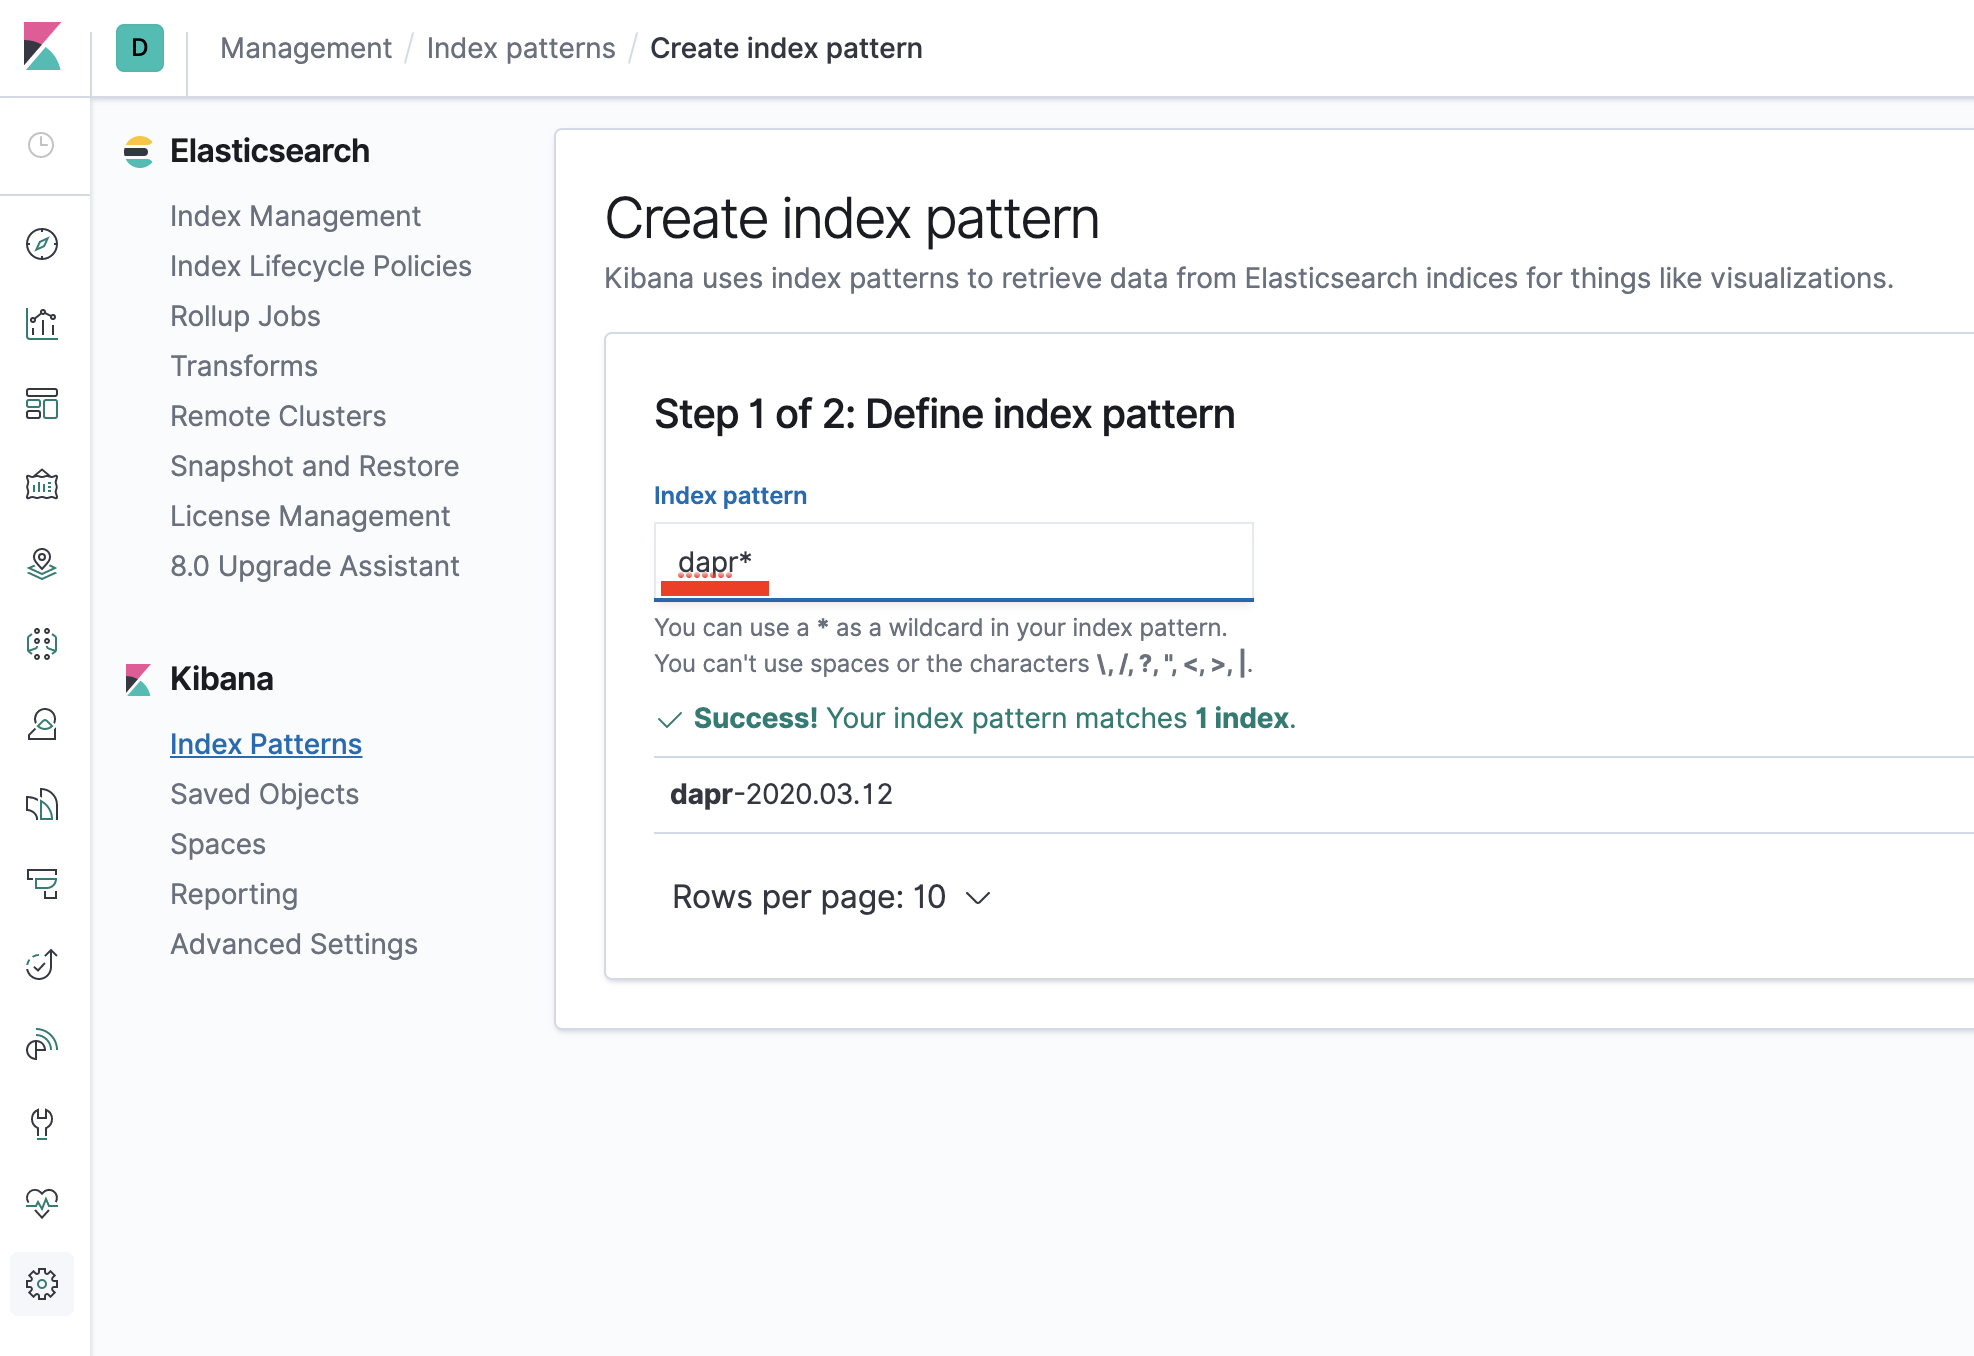
- Once dapr-* indexed, click Kibana->Index Patterns and Create Index Pattern
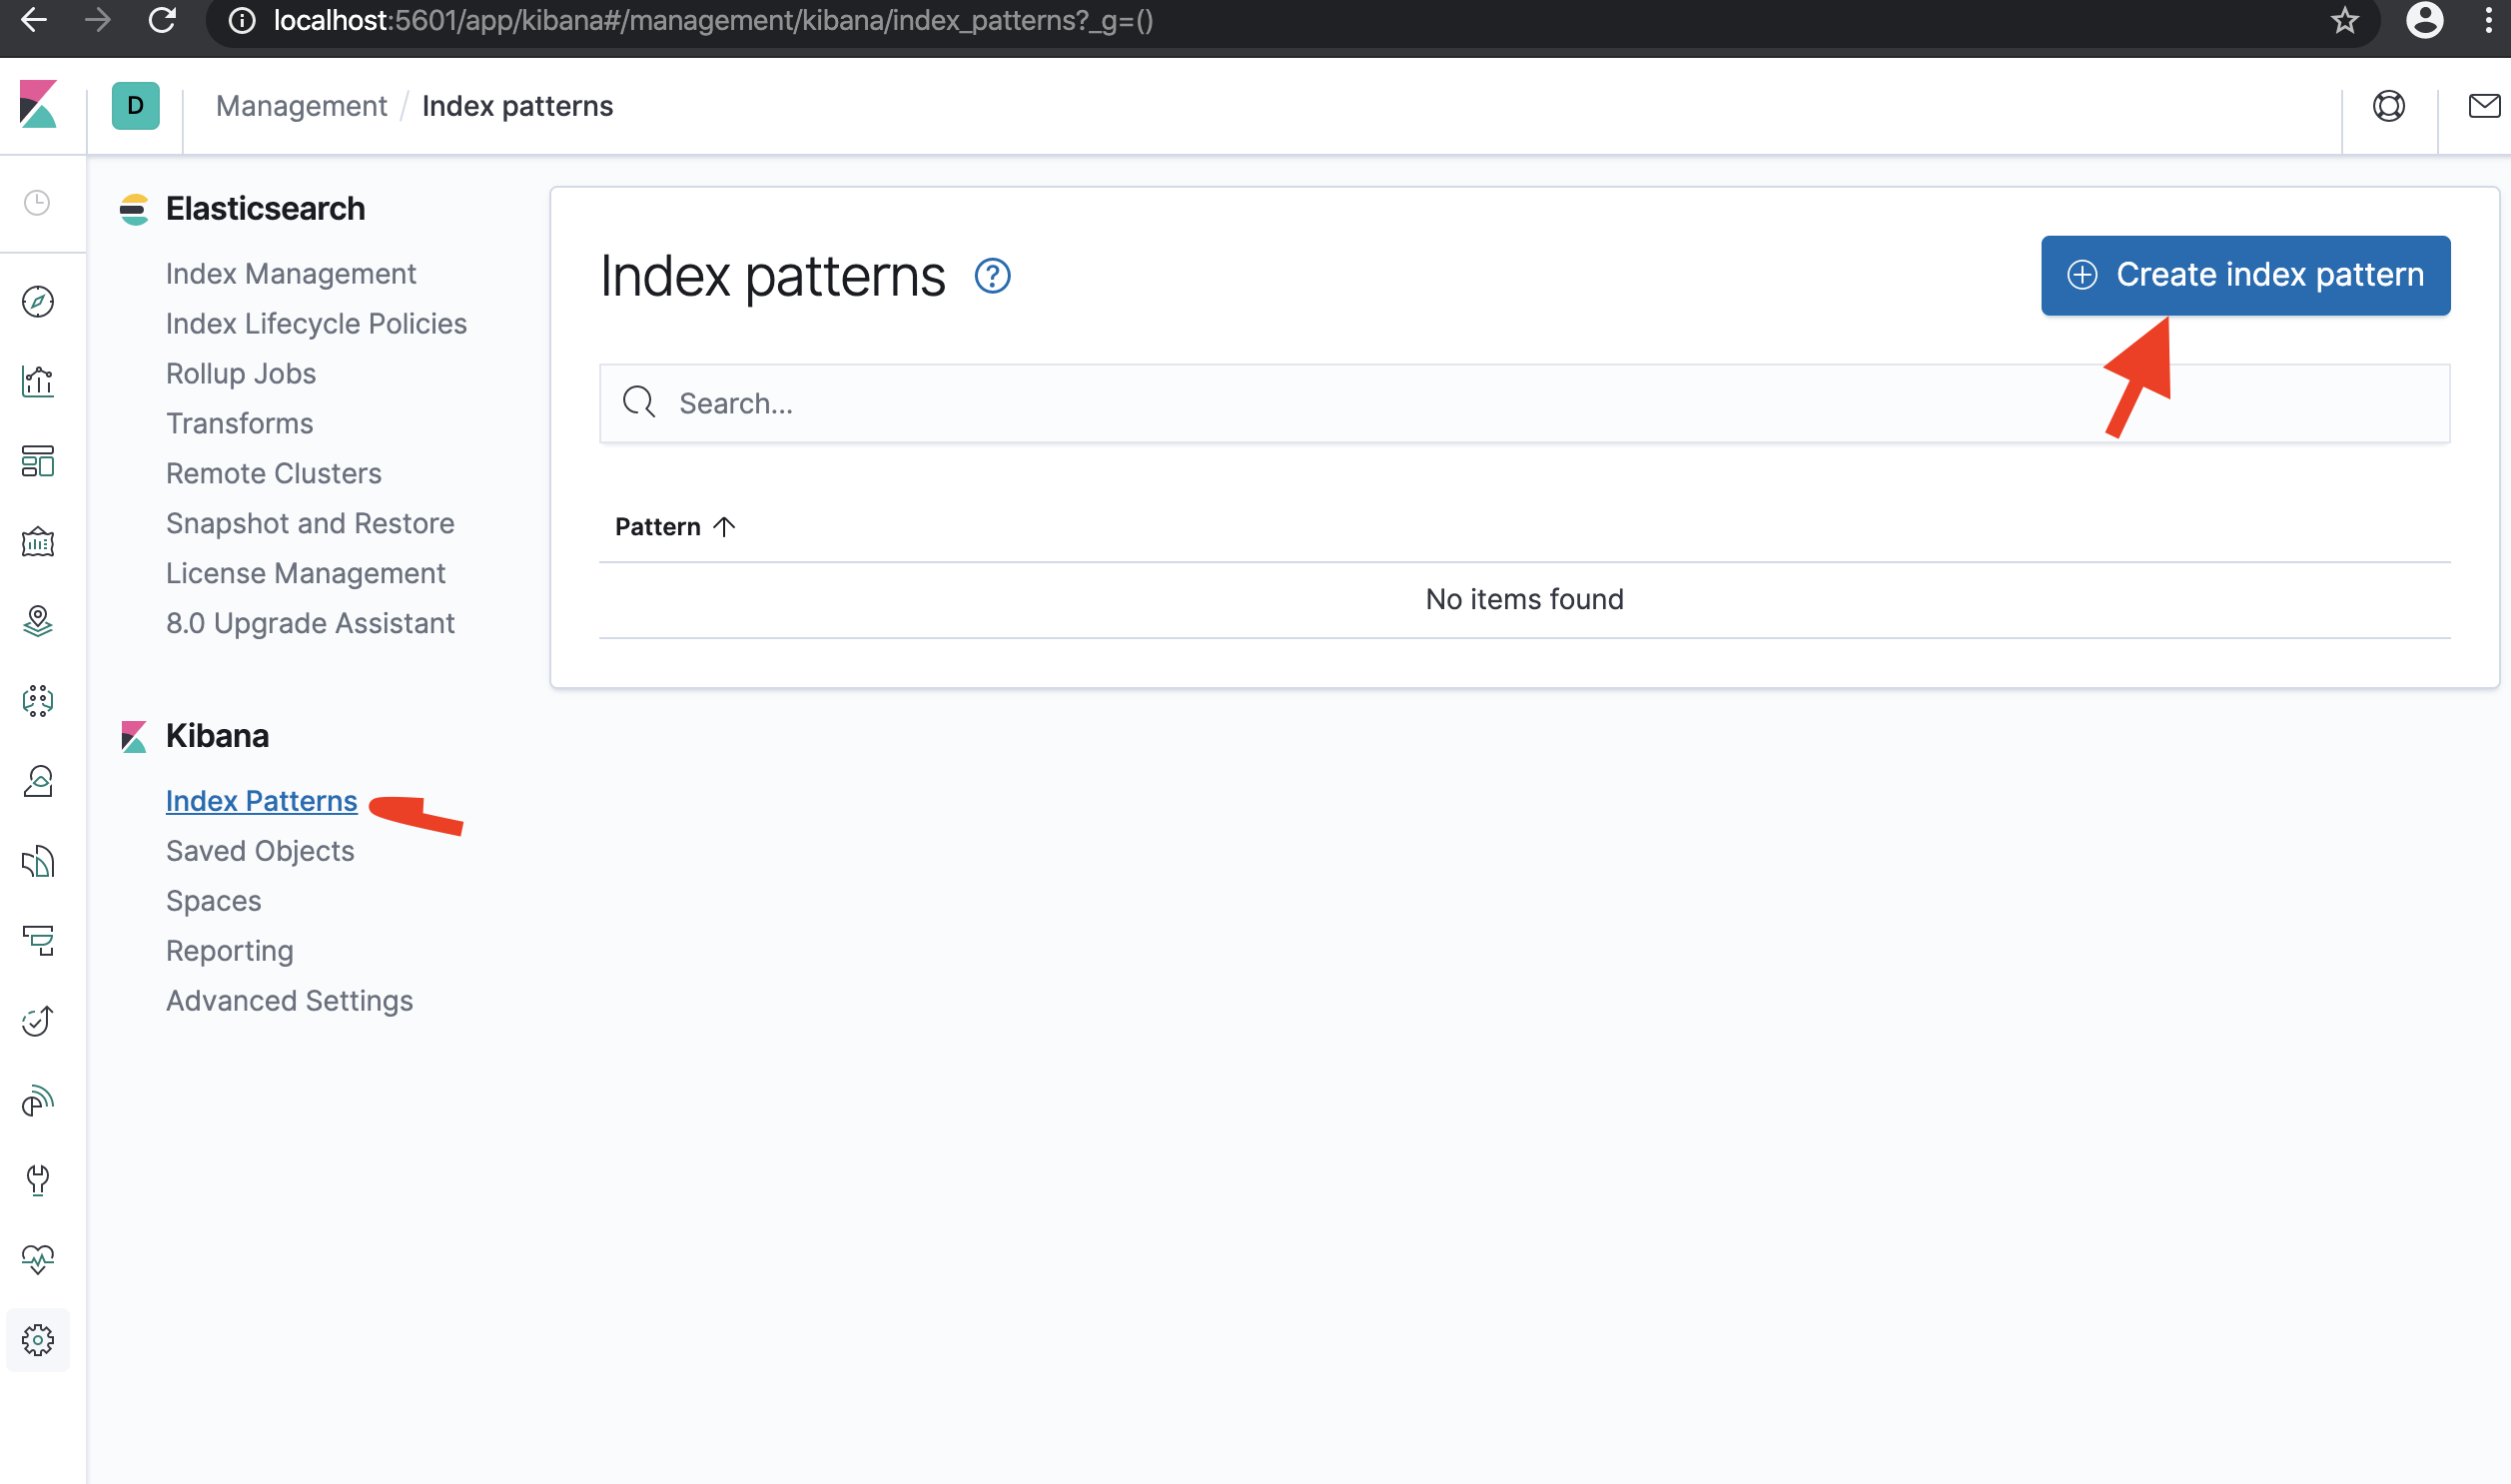
- Define index pattern - type
dapr*in index pattern
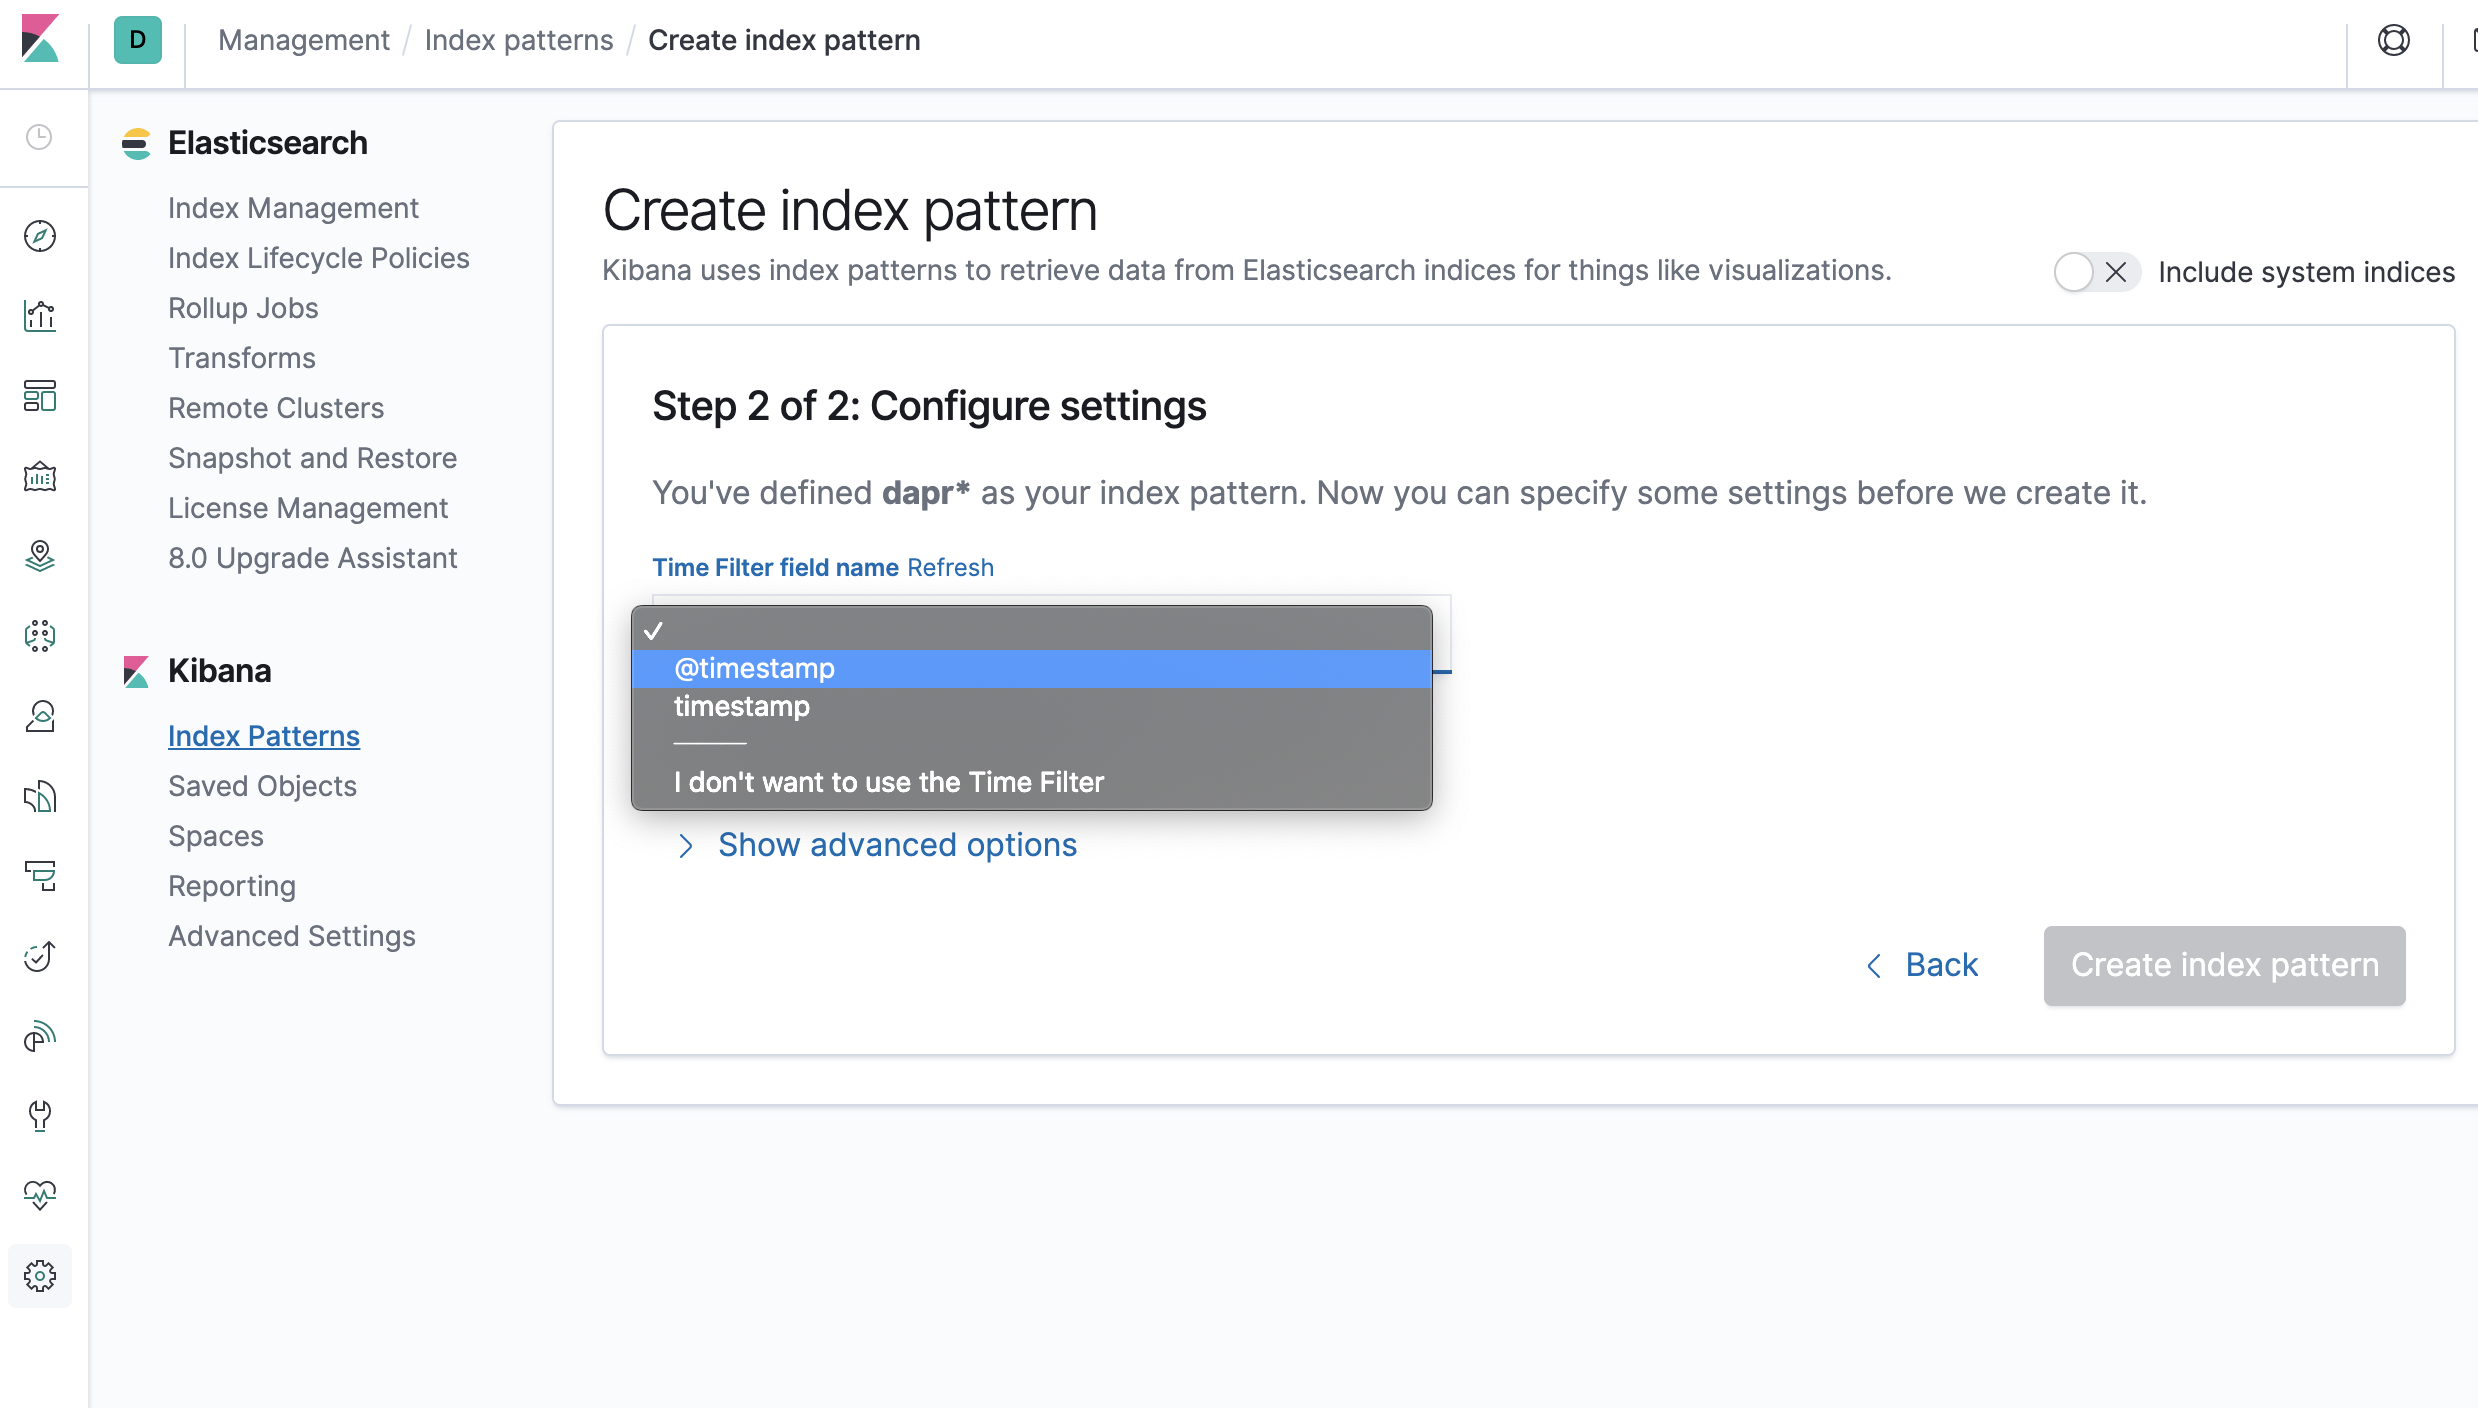
- Select time stamp filed:
@timestamp
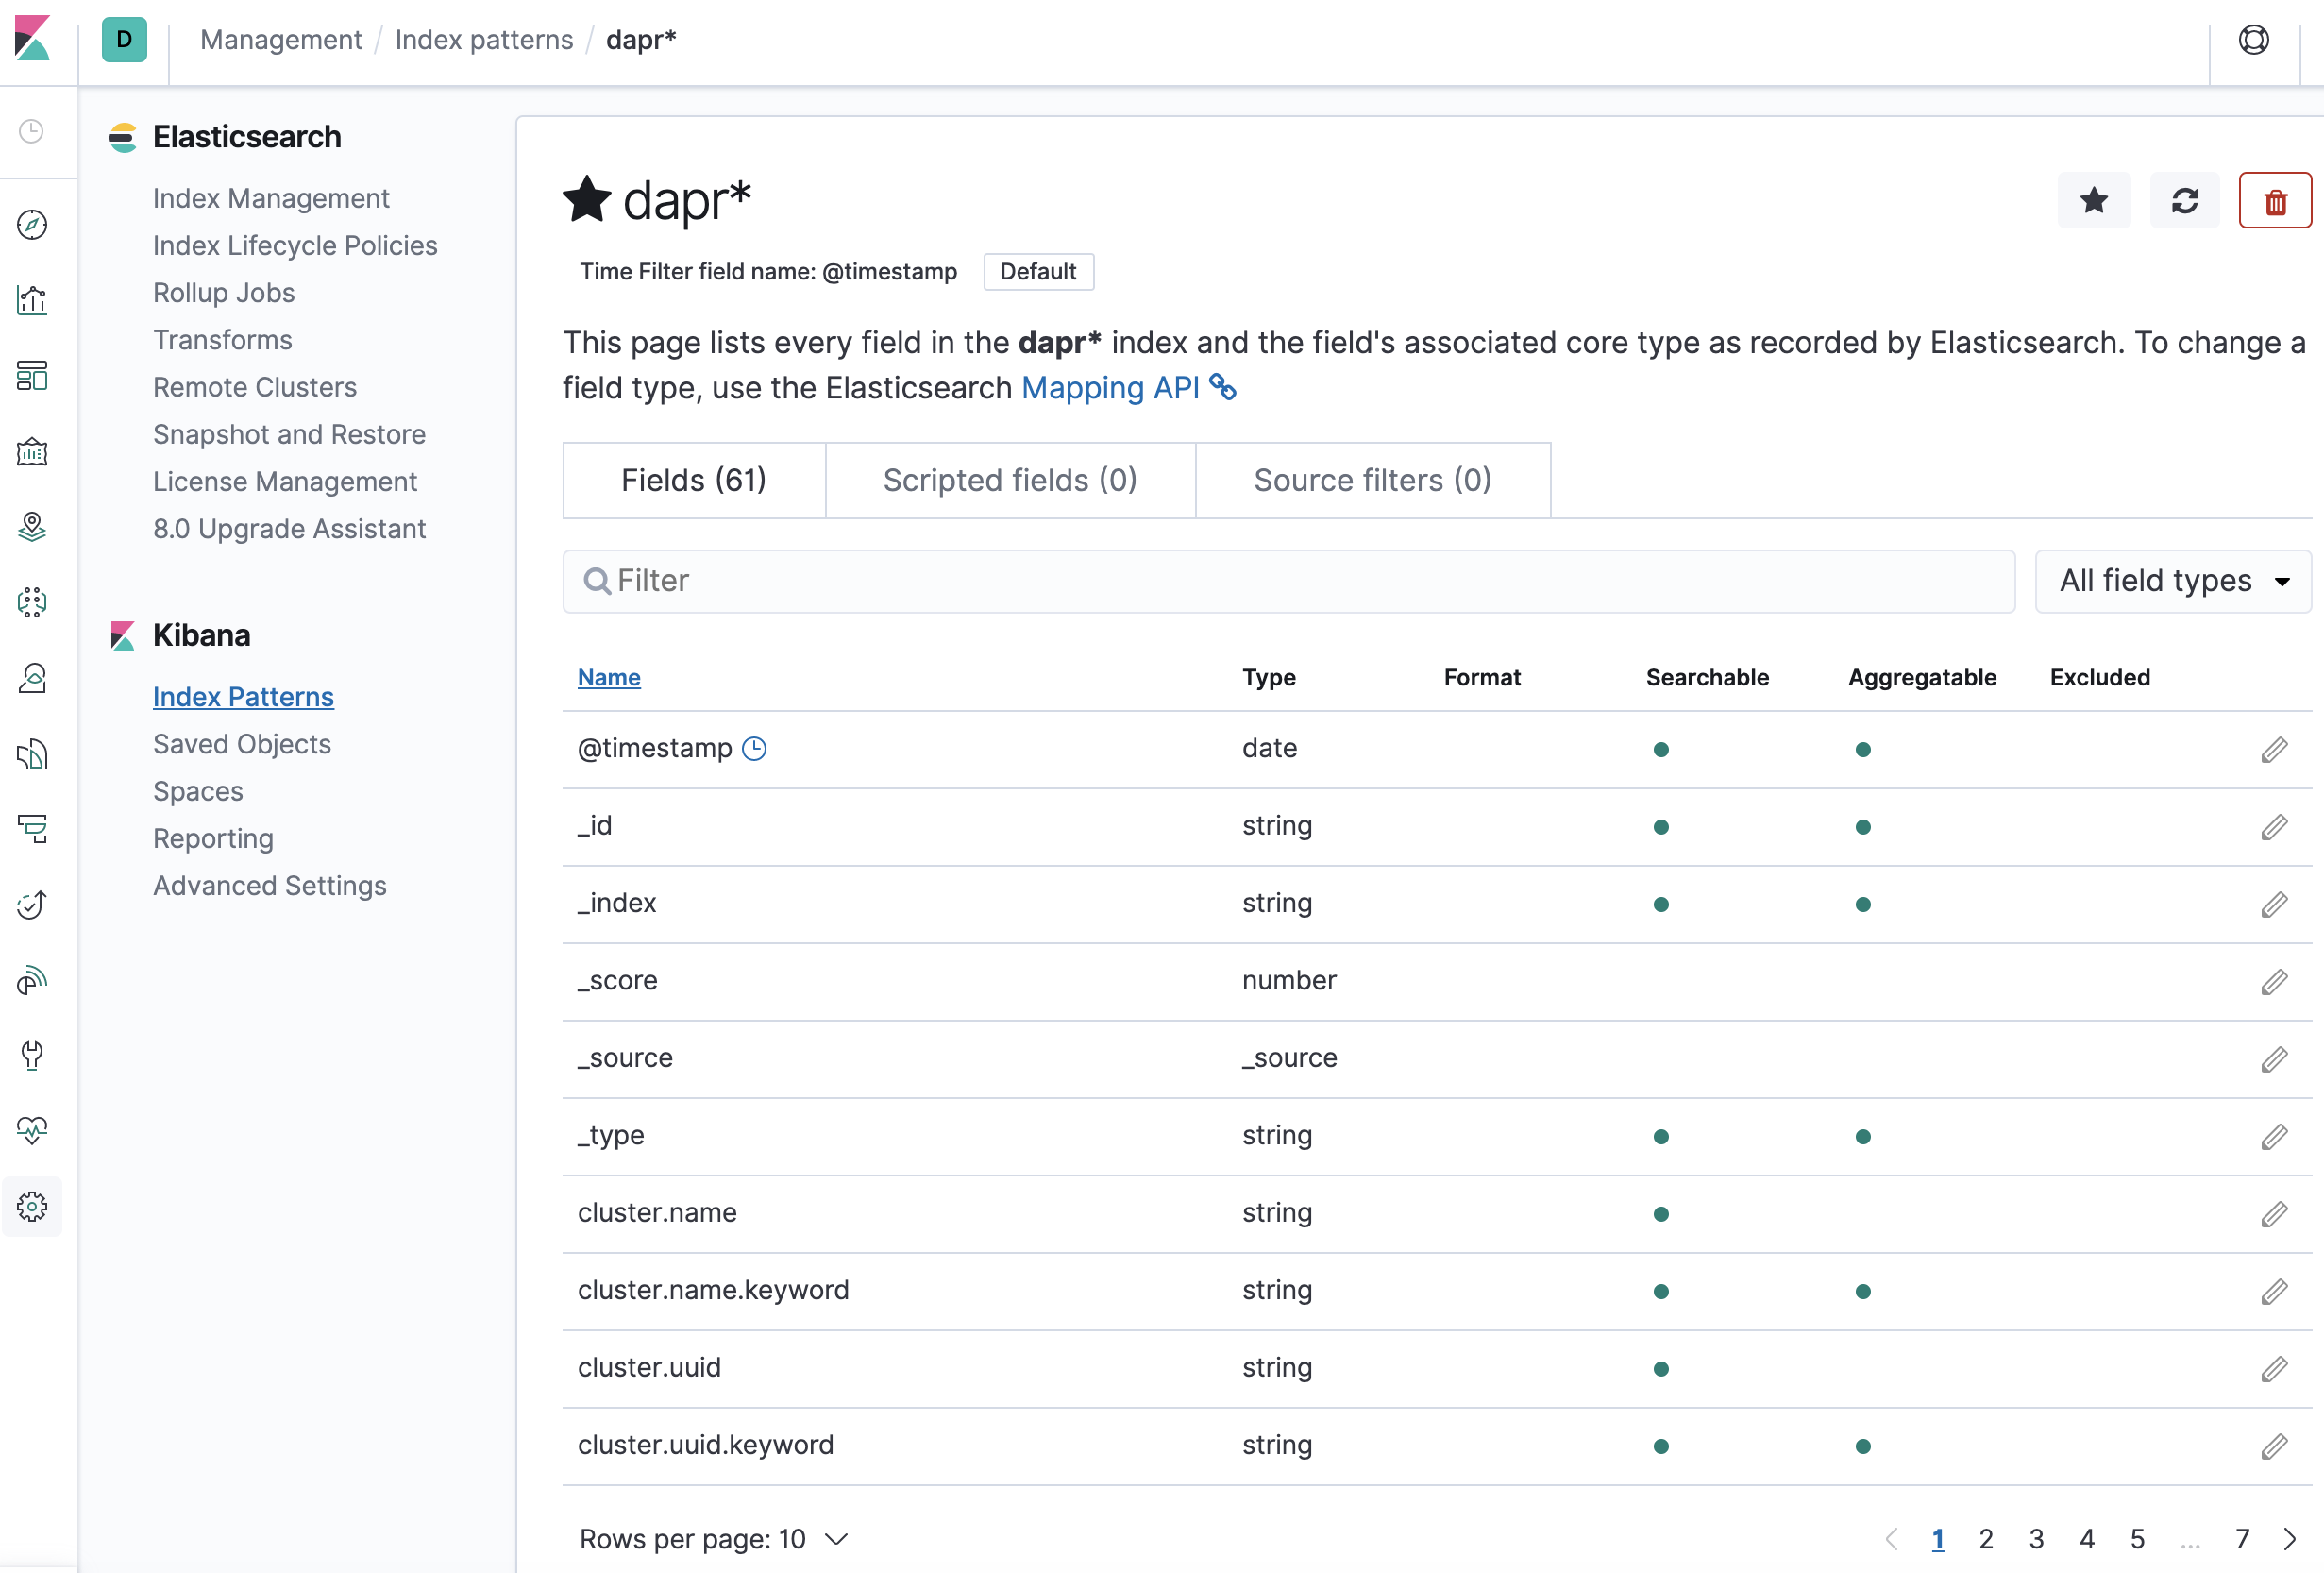
- Confirm that
scope,type,app_id,level, etc are being indexed.
Note: if you cannot find the indexed field, please wait. it depends on the volume of data and resource size where elastic search is running.
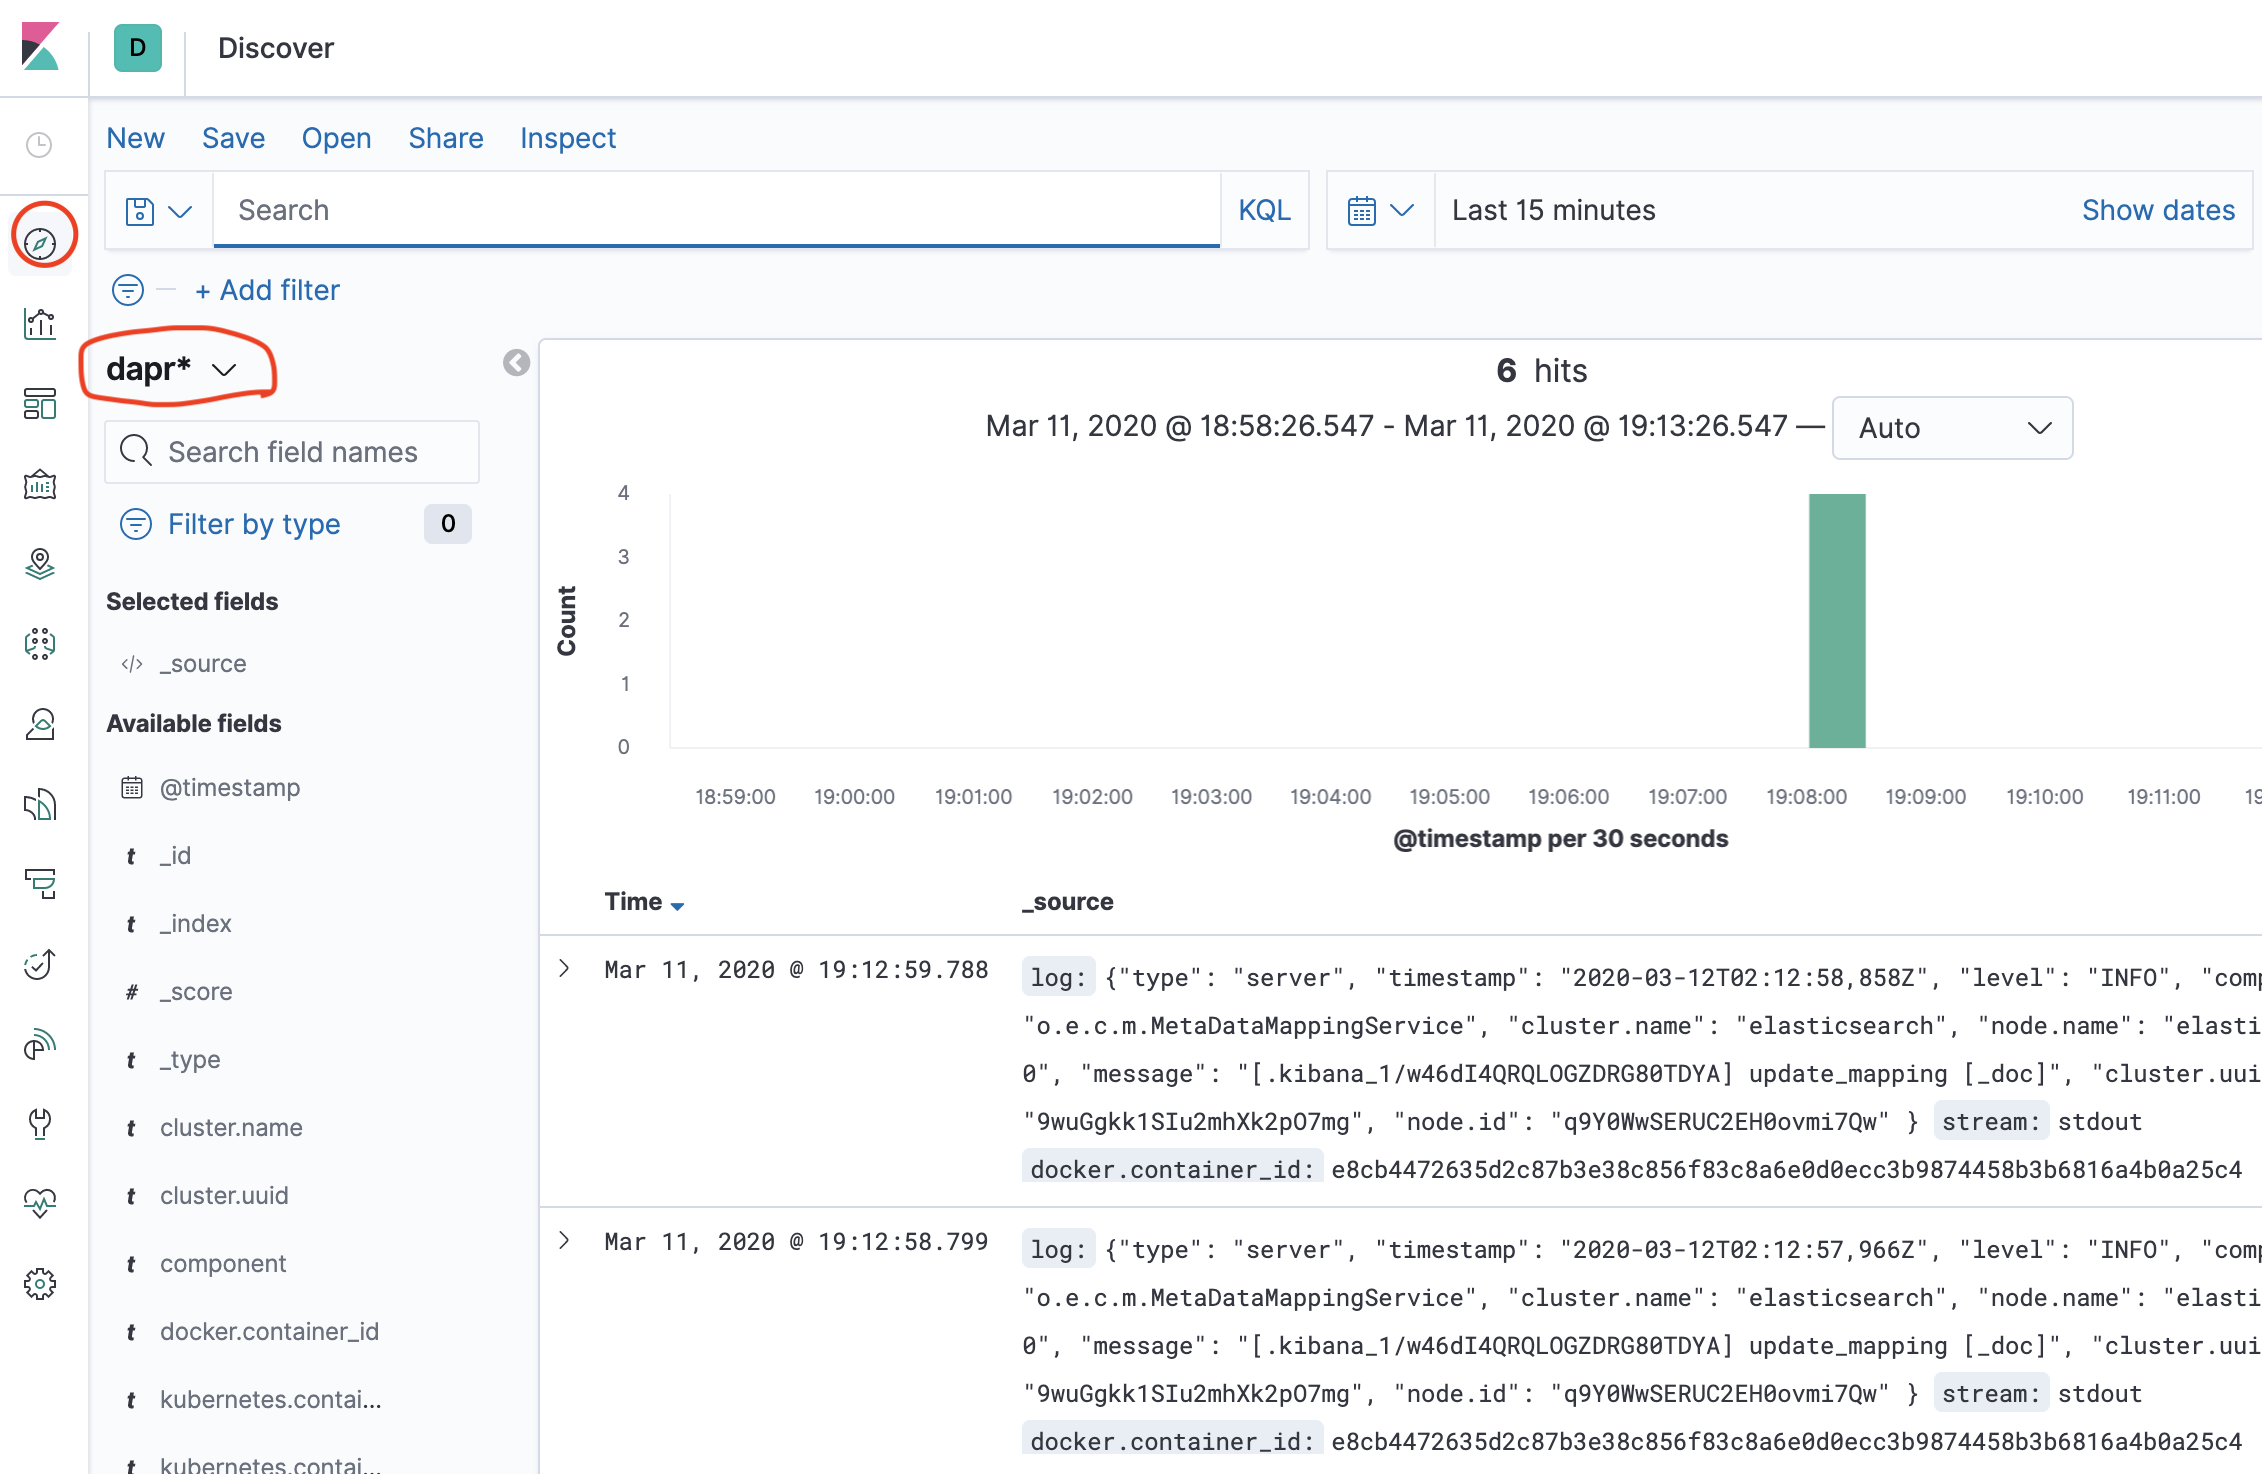
- Click
discovericon and searchscope:*
Note: it would take some time to make log searchable based on the data volume and resource.